Processing QC Reports
The auto_process make_fastqs command outputs an HTML report summarising read counts by lane, project and sample. The report gives a quick overview of the quality of the demultiplexing and tries to highlight potential problems.
An example of the top of a processing QC report page is shown below:
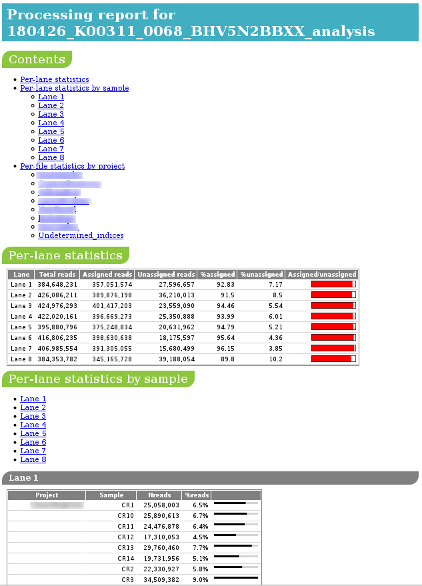
The report comprises three sections:
Per-lane statistics
This section gives an overview of how well demultiplexing has worked for each lane, by listing the proportion of reads in each lane which have been assigned to samples from the sample sheet.
An example where demultiplexing has worked well looks like:
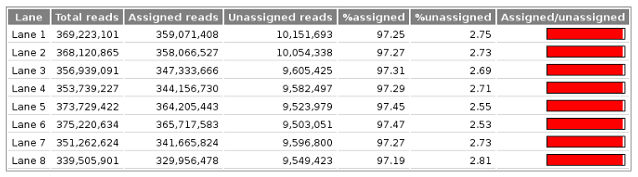
The red barplots give a quick indication of the percentage of reads which were assigned; typically >95% indicates very good demultiplexing.
An example where demultiplexing has been less successful for some lanes might look like:
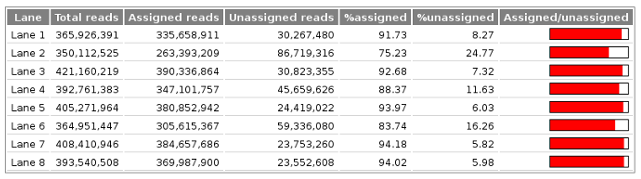
In this example it is apparent that much lower percentages of reads in lanes 2 and 6 have been assigned to samples compared with the other lanes.
In extreme cases where the assigned percentages are very low these plots might indicate that there is a problem with the barcode sequences used in demultiplexing; in this case the barcode analysis report may provide more insight into any issues with barcode assignments..
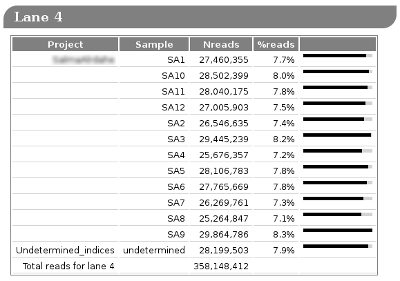
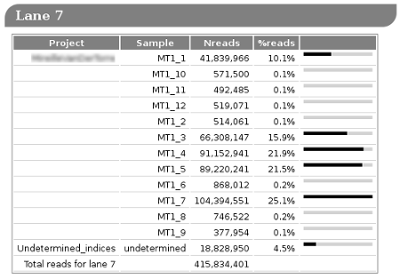
Per-lane statistics by sample
This section lists the number of reads assigned to each sample within each lane, with an indication of the proportion those reads are of the total number of reads in the lane. This can highlight samples with a disportionately low or high number of reads compared to others in the same lane.
An example where reads are evenly distributed across all samples might look like:
This can be contrasted with an example where some samples have very low read counts compared to others:
Per-file statistics by project
This section gives detailed statistics for each project in the run, broken down by Fastq file.
For example:
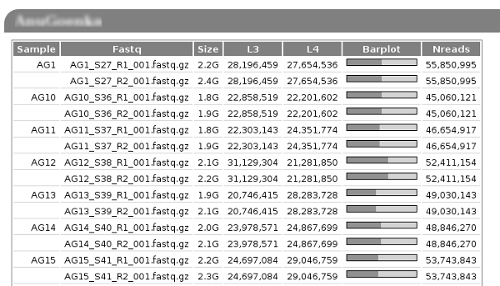
For each Fastq the table lists:
File size
Number of reads from each lane that the sample was run in
Barplot indicating the proportion of reads from each lane
Total number of reads in the Fastq file